December 6, 2021
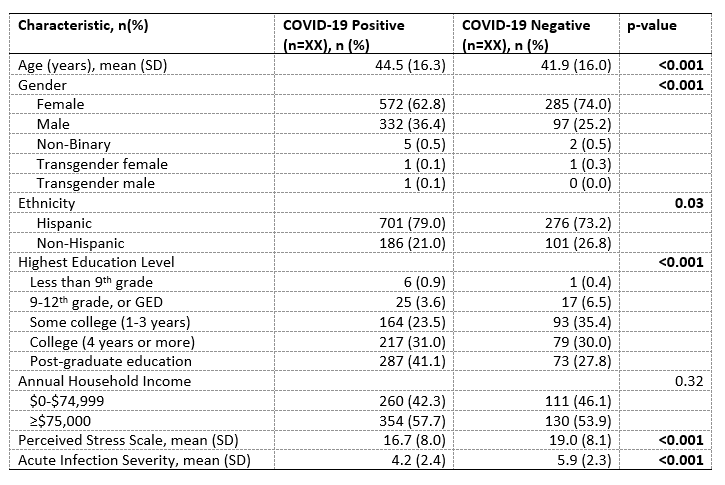
In epidemiology, a Table 1 describes the case or participant sample through basic demographics, exposures, and risk factors. The table command in Stata 17+ is an awesome resource for epidemiologists to create shareable tables quickly.
In this blog I take you through my favorite cheat codes and formatting for creating a beautiful, ready-to-share table in Stata 17+. Learn how to format and create tables in Stata that are publication ready!
In my Table 1 Freebie, I share all the code you need to transform your data into a beautiful Table 1 ready for sharing with stakeholders or in a publication.
Creating a Table 1 in Stata
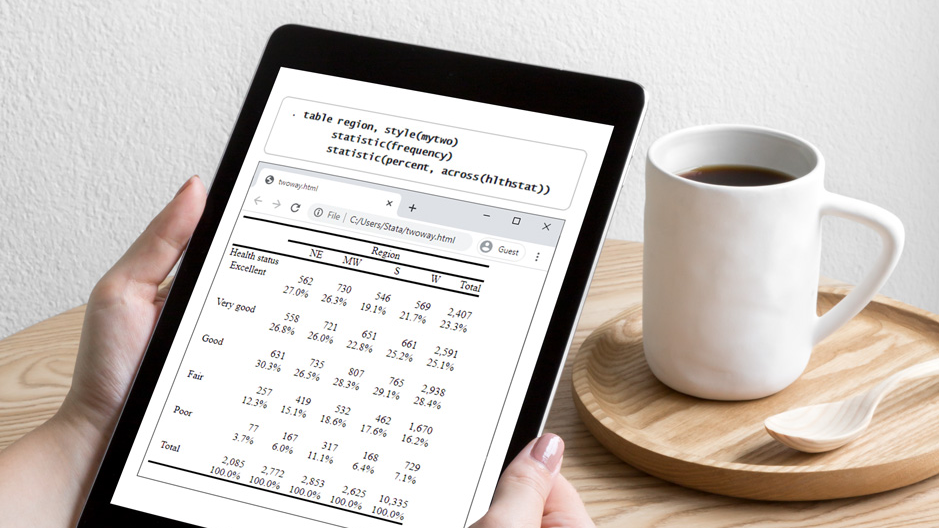
In the past, I’ve used this code to create tables like this with just a click of a button:
Having code to create your tables is also great for when you inevitably have to re-do the table when a colleague, or a reviewer, asks you to add something more. In this instance, all you have to do is just add in that new variable, or modify your code, and click “run” to get a brand new revised table!
Below I share some of my best formatting tips, which you can append to my Table 1 Freebie code, to get beautiful-looking tables you’ll be excited to share. Let’s get into the code!

Labeling Variables in Table 1
Once you export the file into Word or Excel, you may be tempted to change the variable names and formatting – why not let Stata do that for you? With this code you can change the variable and value names that often appear in the first column of a Table 1.
Execute this code before you run the table command.
label var varname “Variable Name”
label define varname_ 0 “No” 1 “Yes” 99 “Unknown”
label values varname varname
This code helps you label variables, and variable categories to display in the table. Make sure to execute this code for every variable you would like displayed in your table.
Highlighting Table 1 P-values and Confidence Intervals
To change how your p-values or confidence intervals display, append your collect style statements with the following:
collect style cell result[_r_ci], cidelimiter(,)
This code will ensure your confidence intervals are shown in the same column, separated by a comma. You can also use a similar code to include frequencies and percentages within the same cell, separated with parentheses.
Saving your Table 1 Style
The best, and I mean the BEST, part of this code, is once you have a format you love, you can save this style and apply it to all future tables in Stata. Stata even offers some default table options. After you’ve specified the collect style commands, execute this code:
collect style save mytablestyle.stjson, replace
Then when you’re ready to use your style again, just execute:
collect style use mytablestyle, replace
Alternately, in your table command line, just add this to the end:
style(mytablestyle)
And, if you really love your style and want to make it the default, execute:
set table_style mytablestlye, permanently
Save often and keep your results reproducible!
Automating your tables in Stata will save you time, giving you that valuable time back to serve and share those results to the communities you care about the most.
Have a dataset but no time to analyze it?


Comments